The Sleeping Inflation Giant Hidden in Semiconductor Data

Economists watch oil. 

Politicians watch groceries and rent. 

Markets watch the Fed. 

Everyone is watching gas and diesel prices.

But buried deep inside a relatively obscure U.S. Bureau of Labor producer-price series may be an entirely different inflation story — one that could define the next decade of enterprise economics.

The number is semiconductor and electronic component producer pricing .

And it may be flashing a warning that almost nobody is talking about.

The Data Nobody Is Looking At

The producer price index for semiconductors and electronic components is most easily accessed through the Federal Reserve Bank’s FRED® platform (series ID PCU3344133441). Upon review, the data looked almost boring through most of 2025.

For months, prices barely moved. Then something changed. By August 2025, prices began climbing.  By early 2026, they exploded.

 reserve obs get PCU3344133441 --start 2024-01-01 --end 2026-05-01 --format jsonl   | reserve transform resample --freq monthly --method mean   | reserve chart bar
PCU3344133441  2024-01  2026-04
2024-01  57.88  ██
2024-02  58.05  ██
2024-03   58.1  ███
2024-04  58.26  ███
2024-05   58.2  ███
2024-06  58.06  ██
2024-07  57.46  
2024-08  57.49  
2024-09  57.54  
2024-10   58.0  ██
2024-11  58.94  ██████
2024-12  58.83  █████
2025-01  58.27  ███
2025-02  58.07  ██
2025-03  58.42  ████
2025-04  58.32  ███
2025-05  58.33  ███
2025-06  57.61  
2025-07  57.58  
2025-08  59.64  █████████
2025-09  59.77  █████████
2025-10  60.12  ███████████
2025-11  60.87  ██████████████
2025-12  61.06  ██████████████
2026-01  61.58  ████████████████
2026-02  66.99  ██████████████████████████████████████
2026-03  68.21  ███████████████████████████████████████████
2026-04  73.48  ████████████████████████████████████████████████████████████████

Source: Bureau of Labor Statistics via FRED

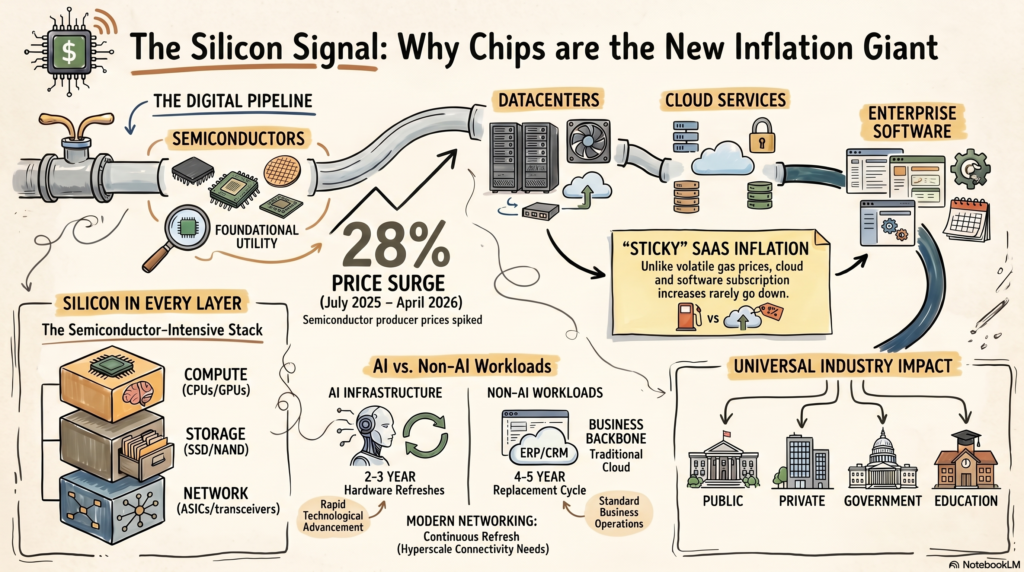
From the July 2025 low to April 2026, semiconductor and electronic component producer prices surged nearly 28%.

That is not the kind of inflation shock typically tied to oil tankers drifting through the Strait of Hormuz or temporary commodity volatility. It is a structural repricing event — one most observers would immediately attribute to the AI gold rush. And they are probably partially correct.

But the implications may reach far beyond AI accelerators themselves.

Semiconductors are no longer just components inside consumer electronics. They are rapidly becoming the foundational infrastructure layer beneath cloud computing, enterprise software, logistics systems, financial platforms, industrial automation, and increasingly the broader economy itself.

If the economics of compute are changing, then the inflation story may be changing with them.

Economists May Be Looking in the Wrong Place

Traditional inflation models were built around industrial-era economics. The classic inflation pipeline looked like this:

Energy -> Transportation -> Manufacturing -> Consumers

That framework makes sense for a physical economy dominated by: fuel, shipping, factories, and commodity production. But the modern economy runs on something else. Increasingly, the real pipeline looks like this:

Semiconductors & Electronics -> Datacenters -> Cloud Services -> Enterprise Software -> Every Industry

This is the inflation architecture of a digital economy. And it changes everything.

Compute Has Become a Foundational Industrial Input

For decades, technology was deflationary. Compute, storage, and bandwidth consistently got cheaper. Infrastructure as a Service (IaaS) and Software as a Service (SaaS) promoted lower total cost of ownership and operational efficiency as core selling points. In many cases that promise proved true. In others, it simply shifted costs from internal IT departments into recurring vendor contracts.

What the broader cloud industry unquestionably established, however, was the normalization of annual price increases embedded inside multi-year customer commitments.

For years, none of this appeared dangerous because the underlying economics of technology remained deflationary. The market internalized the idea that technological progress naturally lowers costs over time.

But what if that assumption is beginning to break?

Part of the answer may lie in how the architecture of cloud infrastructure itself has changed.

Historically, the industry treated compute, storage, and bandwidth as distinct infrastructure categories:

  • compute meant CPUs and servers,
  • storage meant hard drives and storage arrays,
  • bandwidth meant fiber and networking equipment.

Today, all three increasingly collapse into one semiconductor and electronic component intensive stack.

Compute is obviously driven by CPUs, GPUs, accelerators, and memory. But storage is now dominated by NAND flash and SSD controllers. Even bandwidth is no longer “just fiber.” Modern hyperscale networking depends on switching ASICs, optical transceivers, packet processors, NICs, DSPs, and routing silicon. The intelligence layer of the modern internet is semiconductor-driven.

The result is that cloud infrastructure has quietly become an enormous assembly of semiconductor and electronic component based systems connected by glass.

And cloud infrastructure is no longer a niche industry. It is becoming the operational backbone of the global economy.

Payroll systems, logistics platforms, ERP software, CRM systems, healthcare infrastructure, and financial platforms now run inside hyperscale datacenters. These are not speculative AI workloads. They are ordinary, everyday business operations that increasingly depend on semiconductor-intensive infrastructure.

This matters because hyperscalers are entering a perpetual hardware replacement cycle.

That is why a sustained rise in semiconductor and electronic component producer prices matters. If these input costs remain elevated — or continue rising — the effects will eventually work their way through the cloud stack itself, placing upward pressure on SaaS, IaaS, AI inference, and enterprise software pricing.

Not immediately. Hyperscalers hedge aggressively, negotiate long-term supply contracts, and amortize infrastructure investments over years. But producer-price inflation at the hardware layer rarely disappears permanently. Eventually, it surfaces somewhere in the economics of the digital economy.

The Economics Nobody Wants to Talk About

When people discuss AI infrastructure, they focus on model capabilities.

But the economic story is much larger. Google Cloud recently reported:

  • $20 billion in quarterly revenue,
  • 63% year-over-year growth,
  • A staggering $462 billion contract backlog

That backlog may be the most important number.

Why?

Because it signals that corporations are committing themselves to long-duration cloud dependence.

These are not experimental workloads or simple eliminations of “server closets” anymore.  Cloud infrastructure is becoming mandatory infrastructure. And mandatory infrastructure eventually gains pricing power.

The Replacement Cycle Problem

The semiconductor story becomes even more interesting once you examine hardware replacement cycles. Traditional enterprise servers were typically replaced every 4–5 years. That cycle roughly holds true for the racks of compute infrastructure that powers IaaS and SaaS offerings. AI infrastructure may need replacement every 2–3 years — possibly even faster.  The result has been and will continue to be growing and persistent semiconductor demand.  Not cyclical demand.  Not temporary demand.  Permanent demand.

What Happens If Compute Stops Being Deflationary?

This is the macroeconomic question sitting quietly beneath the surface of the semiconductor data. What happens if compute itself becomes inflationary?

The Bureau of Labor Statistics has been tracking Semiconductor as a separate price index since 1984. For those who lived it, you remember the story as prices came down and the economy digitized. The financial crisis of 2008 did not have material impact nor did the post COVID recovery era.

reserve obs get PCU3344133441 --start 1984-01-01 --end 2026-04-30 --format jsonl   | reserve transform resample --freq annual --method mean   | reserve chart bar
PCU3344133441  1984  2026
1984  100.0  ████████████████████████████████████████████████████████████
1985  100.5  █████████████████████████████████████████████████████████████
1986  102.4  ███████████████████████████████████████████████████████████████
1987  102.6  ███████████████████████████████████████████████████████████████
1988  104.0  █████████████████████████████████████████████████████████████████
1989  105.1  ███████████████████████████████████████████████████████████████████
1990  104.9  ██████████████████████████████████████████████████████████████████
1991  104.9  ██████████████████████████████████████████████████████████████████
1992  104.6  ██████████████████████████████████████████████████████████████████
1993  105.3  ███████████████████████████████████████████████████████████████████
1994  104.8  ██████████████████████████████████████████████████████████████████
1995  102.6  ███████████████████████████████████████████████████████████████
1996  99.31  ███████████████████████████████████████████████████████████
1997  95.13  ██████████████████████████████████████████████████████
1998  91.85  █████████████████████████████████████████████████
1999  90.09  ███████████████████████████████████████████████
2000  88.76  █████████████████████████████████████████████
2001  86.38  ██████████████████████████████████████████
2002  84.86  ████████████████████████████████████████
2003  81.08  ███████████████████████████████████
2004  78.27  ███████████████████████████████
2005  76.49  █████████████████████████████
2006  75.14  ███████████████████████████
2007   70.2  █████████████████████
2008  66.27  ███████████████
2009  65.39  ██████████████
2010  63.86  ████████████
2011  61.55  █████████
2012  59.52  ██████
2013  59.23  ██████
2014  58.77  █████
2015  58.38  █████
2016  57.33  ████
2017  56.81  ███
2018  55.98  ██
2019  55.34  
2020  54.77  
2021  54.66  
2022  56.86  ███
2023  57.19  ███
2024  58.07  █████
2025   59.0  ██████
2026  67.57  █████████████████

Source: Bureau of Labor Statistics via FRED

Enter late 2025 and the start of 2026 and semiconductor returns to mid-2000 levels as if it went through an overnight time machine! The difference is that the number of business critical corporate and government workloads that have been migrated to the cloud in the last 20 years has been exponential.

To net it out, rising semi-conductor costs lead to rising cloud infrastructure cost.  These costs are the inputs that will drive up SaaS software operating costs and find their way financials just about every sector of the economy both private and public.

The result is a new kind of inflation transmission mechanism. This will not taking place through gasoline pumps but through recurring software invoices. And unlike commodity spikes, SaaS inflation is sticky. Once enterprise subscription pricing rises, it rarely falls.

The New Inflation Utility

Electricity became a universal industrial utility in the 20th century.  Compute may be becoming the equivalent utility of the 21st century. If so, semiconductors are no longer just components. They are upstream economic infrastructure. Which means semiconductor pricing may increasingly behave less like a cyclical technology sector and more like a foundational inflation input.

That possibility is hiding in plain sight inside the producer-price data. Yet, the news headlines are still talking about the price of diesel. The next inflation giant may already be sitting quietly inside the datacenter.

Image

Tracking Exploding Beef Prices

Ground beef comes in a wide range of varieties, with pricing influenced by factors such as fat content, grading quality, and premium options like grass-fed beef. Every one of these characteristics affects the final retail price consumers see at the grocery store.

Historically, ground beef prices have moved in cycles, rising and falling alongside broader commodity markets, cattle supply, feed costs, transportation expenses, and consumer demand. But in recent years, something has clearly changed. The long-term trend no longer looks cyclical—it looks relentless. Prices keep climbing, and consumers are feeling it every time they walk through the meat aisle.

What was once considered one of the most affordable and dependable protein options for American families is rapidly becoming another example of persistent food inflation. And according to the data, this isn’t just perception—it’s measurable reality.

Ground Beef Price Data

Two Federal Reserve Economic Data (FRED) series publish monthly average retail pricing data for ground beef:

  • “Average Price: Ground Beef, 100% Beef” (APU0200703112)
  • “Average Price: Ground Beef, Lean and Extra Lean” (APU0000703113)

These datasets provide a long-term view into how dramatically retail beef prices have changed over time. One of the easiest ways to locate the series is by using the FRED search function or RESERVE search command:

reserve search "beef"
Search results for: "beef"

+------------------+----------------------------------------------------+------+----------------------+------------------------+
| ID               | TITLE                                              | FREQ | UNITS                | LAST UPDATED           |
+------------------+----------------------------------------------------+------+----------------------+------------------------+
| APU0000703112    | Average Price: Ground Beef, 100% Beef (Cost per... | M    | U.S. $               | 2026-04-10 07:35:48-05 |
| APU0000FC3101    | Average Price: All Uncooked Beef Steaks (Cost p... | M    | U.S. $               | 2026-04-10 07:35:55-05 |
| PBEEFUSDQ        | Global price of Beef                               | Q    | U.S. Cents per Pound | 2026-04-15 09:59:20-05 |
| PBEEFUSDM        | Global price of Beef                               | M    | U.S. Cents per Pound | 2026-04-15 09:59:19-05 |
| PBEEFUSDA        | Global price of Beef                               | A    | U.S. Cents per Pound | 2026-02-12 09:49:16-06 |
| APU0000704111    | Average Price: Bacon, Sliced (Cost per Pound/45... | M    | U.S. $               | 2026-04-10 07:35:56-05 |
| APU0000703111    | Average Price: Ground Chuck, 100% Beef (Cost pe... | M    | U.S. $               | 2026-04-10 07:35:58-05 |
| APU0000703113    | Average Price: Ground Beef, Lean and Extra Lean... | M    | U.S. $               | 2026-04-10 07:35:47-05 |
| CUSR0000SAF112   | Consumer Price Index for All Urban Consumers: M... | M    | Index 1982-1984=100  | 2026-04-10 08:08:24-05 |
| APU0200703112    | Average Price: Ground Beef, 100% Beef (Cost per... | M    | U.S. $               | 2026-04-10 07:35:50-05 |
| CUUR0000SAF112   | Consumer Price Index for All Urban Consumers: M... | M    | Index 1982-1984=100  | 2026-04-10 08:08:15-05 |
| CUUS0000SAF112   | Consumer Price Index for All Urban Consumers: M... | SA   | Index 1982-1984=100  | 2026-01-13 08:06:22-06 |
| APU0300703213    | Average Price: Chuck Roast, USDA Choice, Bonele... | M    | U.S. $               | 2026-04-10 07:35:32-05 |
| PCU311119311119H | Producer Price Index by Industry: Other Animal ... | M    | Index Dec 2011=100   | 2026-04-14 09:44:18-05 |
| WPU022101        | Producer Price Index by Commodity: Processed Fo... | M    | Index 1982=100       | 2026-04-14 09:34:54-05 |
| WPS022101        | Producer Price Index by Commodity: Processed Fo... | M    | Index 1982=100       | 2026-04-14 09:36:16-05 |
| APU0000703613    | Average Price: Steak, Sirloin, USDA Choice, Bon... | M    | U.S. $               | 2026-04-10 07:35:55-05 |
| APU0000FD4101    | Average Price: All Other Pork (Excluding Canned... | M    | U.S. $               | 2026-04-10 07:35:43-05 |
| APU0000FD3101    | Average Price: All Pork Chops (Cost per Pound/4... | M    | U.S. $               | 2026-04-10 07:35:53-05 |
| APU0100703112    | Average Price: Ground Beef, 100% Beef (Cost per... | M    | U.S. $               | 2026-04-10 07:35:53-05 |
+------------------+----------------------------------------------------+------+----------------------+------------------------+

This search reveals these two series along with other related commodity oriented data series.

Examining the Trend

Price increases are best understood visually. While these series can certainly be exported into a spreadsheet for graphing and further analysis, RESERVE already provides both a powerful transform command set and built-in ASCII charting capabilities.

The transform commands are especially useful for converting raw data into a more macro-level view of the underlying trend. Since both ground beef datasets are published monthly, aggregating the data into quarterly or yearly intervals provides a much clearer picture of the long-term direction of prices while reducing short-term noise.

One of RESERVE’s strengths is composability. The results from the original search can be passed directly into the transform command set and then piped into the charting commands for visualization. The result is shown below:

reserve obs get APU0000703113 --start 2000-01-01 --end 2026-04-30 --format jsonl   | reserve transform resample --freq annual --method mean   | reserve chart bar
APU0000703113  2000  2026
2000  2.26  
2001  2.47  ██
2002  2.58  ████
2003  2.73  █████
2004  2.93  ████████
2005  2.97  ████████
2006  2.93  ████████
2007  3.07  █████████
2008  3.26  ███████████
2009   3.4  █████████████
2010   3.5  ██████████████
2011  3.77  █████████████████
2012  4.06  ████████████████████
2013  4.86  ██████████████████████████████
2014  5.56  █████████████████████████████████████
2015   6.1  ████████████████████████████████████████████
2016  5.71  ███████████████████████████████████████
2017  5.63  ██████████████████████████████████████
2018  5.35  ███████████████████████████████████
2019  5.38  ███████████████████████████████████
2020   5.8  ████████████████████████████████████████
2021  6.03  ███████████████████████████████████████████
2022   6.5  ████████████████████████████████████████████████
2023  6.68  ██████████████████████████████████████████████████
2024  6.95  █████████████████████████████████████████████████████
2025  7.76  ███████████████████████████████████████████████████████████████
2026  8.24  ████████████████████████████████████████████████████████████████████

Source: Bureau of Labor Statistics via FRED

reserve obs get APU0200703112 --start 2000-01-01 --end 2026-04-30 --format jsonl   | reserve transform resample --freq annual --method mean   | reserve chart bar
Checking permissions for APU0200703112...
APU0200703112  2000  2026
2000  1.45  
2001  1.67  ███
2002  1.68  ███
2003  1.96  ██████
2004  2.12  ████████
2005  2.31  ███████████
2006  2.15  █████████
2007  2.14  █████████
2008  2.15  █████████
2009  2.05  ████████
2010  2.11  ████████
2011  2.48  █████████████
2013  3.05  ████████████████████
2014  3.43  █████████████████████████
2015  3.73  █████████████████████████████
2016  3.29  ███████████████████████
2017  3.31  ███████████████████████
2018  3.81  ██████████████████████████████
2019  3.84  ██████████████████████████████
2020  3.88  ███████████████████████████████
2021  4.09  █████████████████████████████████
2022  4.67  ████████████████████████████████████████
2023  4.91  ███████████████████████████████████████████
2024  5.58  ████████████████████████████████████████████████████
2025  6.37  ██████████████████████████████████████████████████████████████
2026  6.85  ████████████████████████████████████████████████████████████████████

Source: Bureau of Labor Statistics via FRED

What is the Root Cause?

The grade-school explanation for rising prices usually simplifies inflation down to basic supply and demand. In reality, modern economies are tightly interconnected ecosystems where countless variables interact simultaneously—each with its own supply constraints, demand pressures, and downstream effects.

Ground beef prices are a perfect example. Retail pricing is influenced not only by consumer demand, but also by cattle inventory levels, feed costs, fuel prices, transportation expenses, labor markets, interest rates, weather conditions, and even import/export dynamics. Every layer of the supply chain contributes pressure to the final price consumers see at the grocery store.

One of the strengths of the FRED system is that this data is publicly accessible for both hobbyists and researchers to explore. For anyone interested in understanding the forces driving the long-term rise in ground beef prices, RESERVE search makes it possible to discover and analyze datasets covering everything from hay and diesel costs to cattle inventories, beef production, and international trade flows.

The Domino’s Problem: Are Consumers Starting to Tap Out?

As of May 2026, the high-level narrative still points to strong consumer spending. Visa’s latest earnings report highlighted 17% revenue growth, partly driven by continued consumer strength.

But this is a K-shaped economy—and not all consumers are participating equally.

On April 27th, Domino’s Pizza told a very different story:

Domino’s Pizza (DPZ) Q1 2026 earnings, reported April 27, 2026, missed analyst expectations for both earnings per share (EPS) and revenue.

More notably:

Same-store sales increased just 0.9%, well below the expected 2.3%.

So which is it? Strong consumer… or weakening demand?

Instead of relying on earnings commentary, we can go straight to the data.

The Signals

Using RESERVE, we’ll look at a few core indicators:

  • Real income
  • Wages (inflation-adjusted)
  • Inflation (overall + food away from home)
  • Consumer sentiment
  • Credit usage

Here’s the command:

reserve obs get AHETPI DSPIC96 CPIAUCSL CUSR0000SEFV UMCSENT REVOLSL \
  --start 2026-01-01 --end 2026-03-31 --format jsonl \
| reserve analyze summary --by-series

The Data

+--------------+-------+----------+--------------+----------+--------------+--------------+--------------+------------+
| SERIES       | COUNT | MISSING  | MEAN         | STD      | MIN          | MEDIAN       | MAX          | CHANGE PCT |
+--------------+-------+----------+--------------+----------+--------------+--------------+--------------+------------+
| AHETPI       | 3     | 0 (0.0%) | 32.0100      | 0.0656   | 31.9400      | 32.0200      | 32.0700      | 0.41%      |
| CPIAUCSL     | 3     | 0 (0.0%) | 328.1137     | 1.9371   | 326.5880     | 327.4600     | 330.2930     | 1.13%      |
| CUSR0000SEFV | 3     | 0 (0.0%) | 391.6097     | 1.0937   | 390.4710     | 391.7060     | 392.6520     | 0.56%      |
| DSPIC96      | 3     | 0 (0.0%) | 18138.2000   | 42.5687  | 18108.7000   | 18118.9000   | 18187.0000   | -0.43%     |
| REVOLSL      | 2     | 0 (0.0%) | 1327241.8450 | 501.4731 | 1326887.2500 | 1327241.8450 | 1327596.4400 | 0.05%      |
| UMCSENT      | 3     | 0 (0.0%) | 55.4333      | 1.8502   | 53.3000      | 56.4000      | 56.6000      | -5.50%     |
+--------------+-------+----------+--------------+----------+--------------+--------------+--------------+------------+

What does the data say?

First, real disposable income (DSPIC96) is falling while prices (CPIAUCSL) are rising. Yet, food away from home (CUSR0000SEFV) is still increasing by 0.56%. Despite the income-to-price gap, there is still a baseline level of consumer activity—but it is happening under pressure.

Real wage growth (AHETPI) is expanding at 0.41%, but it is being outpaced by inflation (CPIAUCSL) at 1.13%. In the context of Domino’s same-store sales, the interpretation is not that consumer spending has collapsed, but that it is quietly falling behind. Credit (REVOLSL) is only marginally expanding, suggesting it is not meaningfully offsetting the wage-to-inflation gap. At the same time, consumer sentiment (UMCSENT) stands out as the clearest signal, dropping sharply by 5.50%.

How does this explain Domino’s Pizza results?

Domino’s core customer skews middle to lower-middle income. In a K-shaped economy—where wage growth lags rising costs for this group—that pressure shows up in softer same-store sales.

By contrast, Taco Bell (Q1 comps +8%) sits further down the curve and is capturing trade-down behavior through aggressive value pricing and promotions.

Bottom line: this isn’t a demand collapse—it’s a margin-sensitive consumer pulling back at the edges.

No affiliation with the Federal Reserve Bank of St. Louis

Not endorsed nor supported by the FRED® API technical team

© 2026 Derick Schaefer